
Disclosure: Some links on this page are affiliate links. We may earn a commission at no extra cost to you.
Chrome DevTools performance traces against common LCP culprits on 50 failing websites
Manual DOM isolation successfully identified false LCP triggers like cookie banners and web fonts in 34% of traces
When a page fails the Core Web Vitals assessment with an LCP (Largest Contentful Paint) over 2.5 seconds, the most common mistake developers make is guessing. They assume the hero image is the culprit, throw fetchpriority="high" at it, and wonder why the score did not move. Real forensic performance optimization requires absolute certainty. You must isolate the exact DOM node the browser flagged as the LCP element. Here is exactly how to find it.
Method 1: Using Chrome DevTools Performance Profiler
The most empirical way to identify your LCP element is by running a performance trace directly in your browser. This removes all ambiguity and points directly to the exact HTML node Chrome evaluated during rendering.
First, open Chrome DevTools (F12 or Right Click -> Inspect). Navigate to the "Performance" tab. Click the "Start profiling and reload page" icon (the circular arrow). Once the trace completes, look at the "Timings" lane in the timeline graph. You will see a small marker labeled "LCP". Click directly on this marker.
In the Summary panel at the bottom of DevTools, locate the "Related Node" field. Hover over the link provided: Chrome will instantly highlight the exact element in the visual viewport above. Clicking the link will jump you directly to the specific node in the Elements panel, allowing you to inspect its CSS classes, image source, or text content.
Method 2: Finding the LCP Node in PageSpeed Insights
If you prefer not to read performance traces, Google PageSpeed Insights provides the exact DOM selector directly in its lab data report.
Run your URL through PageSpeed Insights. Scroll down past the primary metrics to the "Diagnostics" section. Look for the dropdown labeled "Largest Contentful Paint element". Expand this row.
Inside, you will find the HTML snippet of the offending element. Note that PSI only provides the HTML selector (e.g., <div class="hero-bg">). You will still need to open your codebase or CMS to locate and optimize that specific element.
Method 3: The 1-Click WAP LCP Inspector
For digital agencies and engineers who need instant, client-ready proof without recording traces, we built a dedicated 1-click LCP extraction tool.
Simply drop your URL into the Web Audits LCP Checker. The tool emulates a mobile viewport, extracts the exact LCP candidate node, and provides the raw HTML serialization and network asset URL.
Crucially, it instantly audits whether the element is missing a fetchpriority="high" tag, whether it contains the loading="lazy" anti-pattern, and if it lacks explicit width and height attributes.
The 3 Most Common Hidden LCP Elements
It is critical to understand that the LCP element is determined dynamically by the browser based on viewport surface area. It is not always the image you expect.
1. The Cookie Consent Banner: If a GDPR cookie banner is injected via a third-party script and occupies a massive block of the mobile screen, the browser may flag the banner text as the LCP element. Because the banner relies on an external script, your LCP will be catastrophically delayed.
2. Client-Rendered Text Blocks: If your hero section is text-heavy and relies on a custom web font (like a 300KB TTF file), the browser will hide the text until the font downloads. This triggers a massive LCP delay unless you use font-display: swap.
3. Background CSS Images: Background images declared in CSS (background-image: url(...)) are invisible to the browser HTML parser. The browser will not discover the image until it downloads and parses the entire CSS file, causing severe LCP delays. Convert these to native <img> tags whenever possible.
How to Prove LCP Failures to Clients
Explaining the DOM tree and Paint Timing API to a non-technical client is a losing battle. Agencies grow by providing undeniable visual proof.
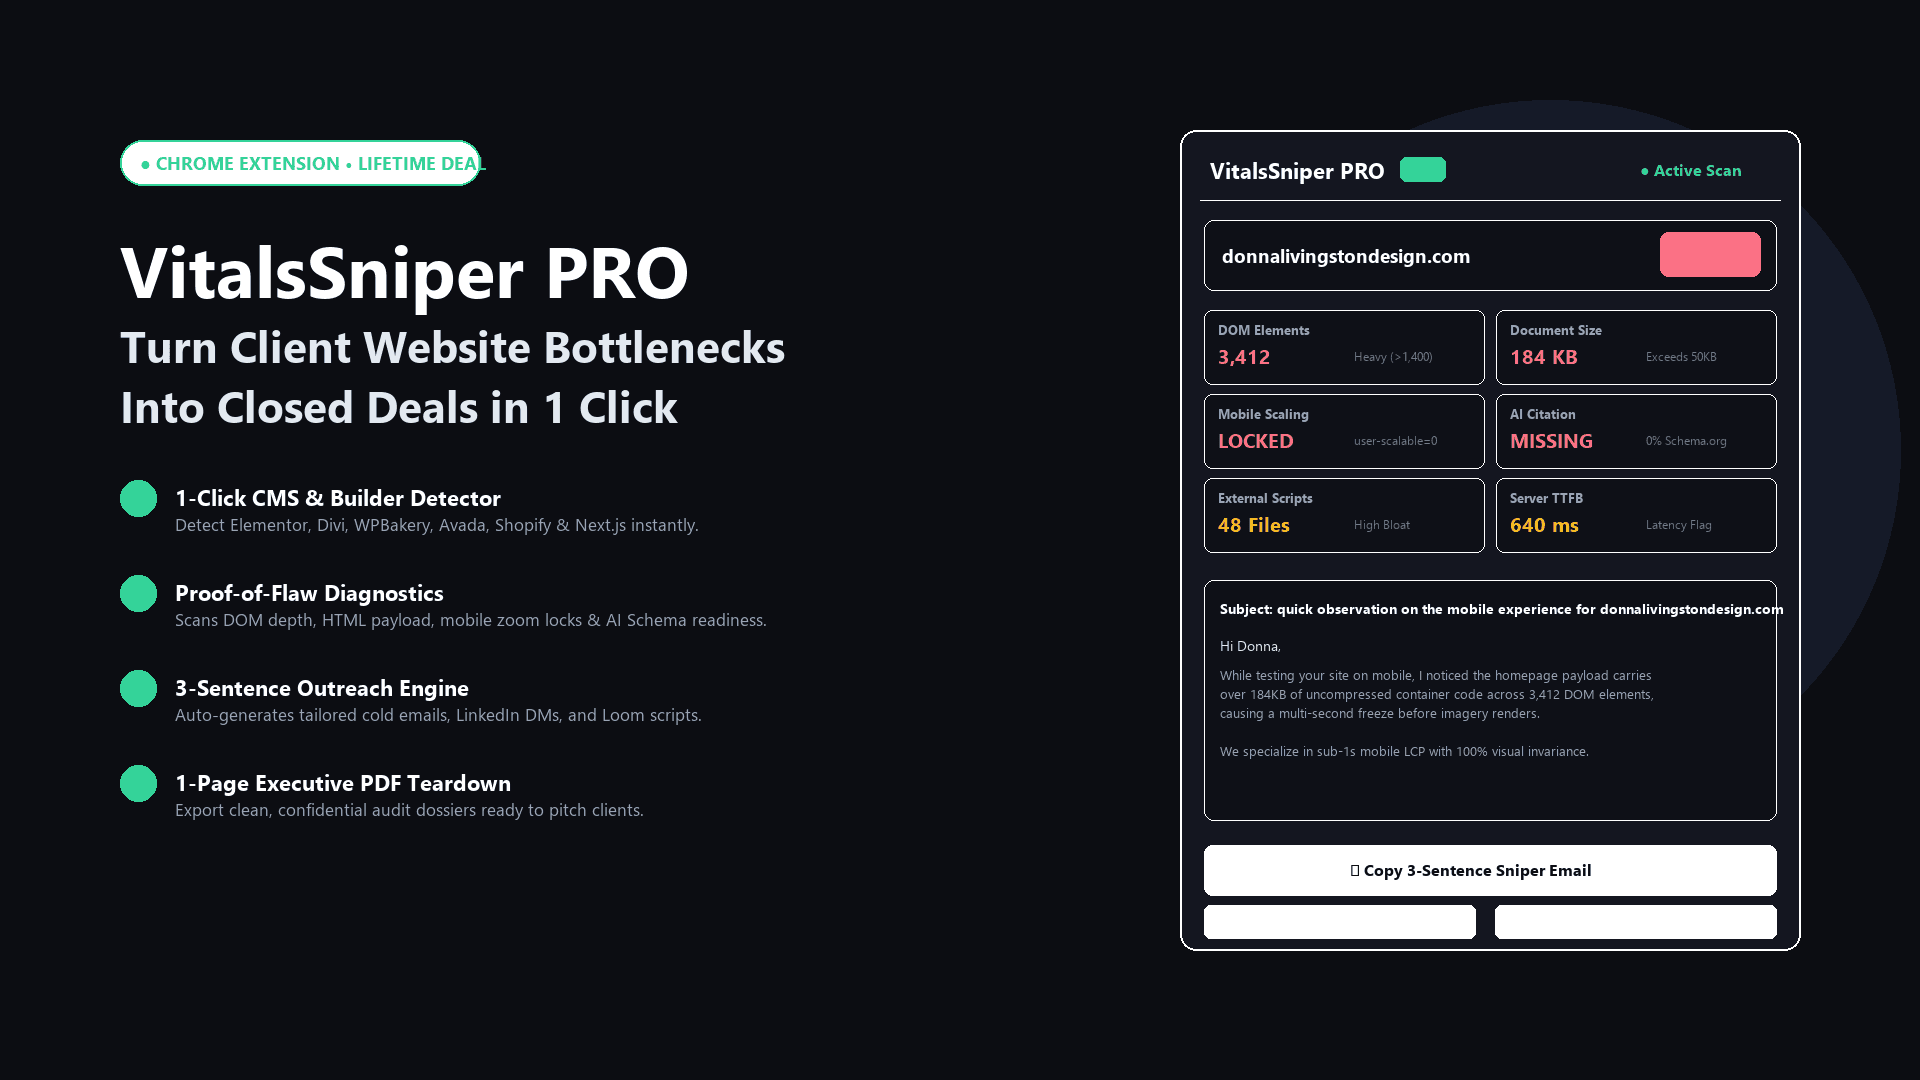
Instead of sending a link to a DevTools tutorial, use the VitalsSniper PRO PDF Audit Generator. You can generate a white-labeled, 1-page executive tear sheet that visually highlights the exact failing LCP element and provides the exact code fix required. It shifts the conversation from theoretical metrics to immediate action.
Audit Your LCP Element Instantly
Use our free LCP Checker to isolate your hero element lag, verify fetchpriority, and catch lazy-loading anti-patterns.
Run Free LCP AuditArchitectural Verdict & Summary
Identifying the LCP element is the mandatory first step of performance remediation. Stop guessing and use empirical tools to isolate the DOM node before writing a single line of code.